Telling the stories of science: Rebecca Wessel ’24 explores digital narratives
-
 Screen shot of Wessel's Map of Life presentation
 -
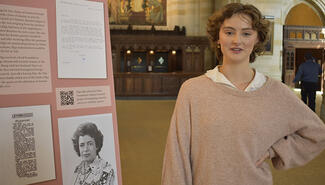
 Summary of Wessel's trip to the Esri Conference
Rebecca Wessel ’24 spent her summer as the climate change technologies fellow at Marx Science and Social Science Library. An environmental studies major, Wessel was already interested in exploring the various intersections of conservation, environmental justice, and spatial mapping (with Geographic Information Systems, or GIS). After completing three data-driven, interactive projects—two of her own design—Wessel came away with critical new skills in her field and plenty of potential topics for her senior thesis.
Inspired by her spring 2022 class “Geographic Information Systems”—with Dana Tomlin, professor in Yale’s School of the Environment—Wessel decided to apply for the school’s Summer Environmental Fellowship, which supports student internships in the field. Right away, Tomlin suggested Wessel speak with Miriam Olivares, GIS librarian, GIS Support Services. As Wessel recalls, “He said, ‘Miriam knows everything about GIS at Yale, and she would be a great person to talk to about summer internships.’ And she was.”
Throughout the fellowship, Wessel worked closely with Olivares; Rachel Sperling, librarian for environmental studies; and Yichen Yang, PhD candidate in the School of Environmental Studies and Marx’s geospatial consultant. Through their weekly meetings, Wessel said, “I was able to gain a greater understanding of what is going on at Yale and how we’re supporting the larger GIS community.” Yale ArcGIS Online (the university’s mapping platform) was created in 2012. Yang has tracked the recent uptick in usage of GIS across Yale. and found that from April 2019 to April 2022, there has been a 333% increase in GIS users at Yale.
Yale Library manages the license with Esri, the software company that developed the ArcGIS suite of products, including ArcGIS Online and desktop. All Yale members have access to the web-based and desktop software and also to free, virtual training. “Yale Library has been great in increasing the GIS footprint across campus,” Olivares added. University-wide access to ArcGIS promotes networking and collaboration among researchers throughout the Yale community who are engaged in geospatial work.
GIS as Research Tool
For her first project, Wessel prepared a presentation for the STARS (Science, Technology and Research Scholars) Program. STARS is a summer research program administered by the Yale College Dean’s Office for students historically underrepresented in the fields of sciences, technology, engineering, and mathematics. Olivares was invited by Dr. Maria Moreno, STARS co-instructor, to teach a weekly GIS workshop to STARS students, and Olivares invited Wessel to make a presentation to them. The workshop focus was food security and food access, something Wessel had studied in previous courses.
To prepare, Wessel explained, “I collected relevant literature that I had read and learned about during the courses I’ve taken, and I put together an ArcGIS StoryMap to talk about how GIS is being used in this field.” ArcGIS StoryMaps is a web-based, interactive, storytelling platform that allows users to combine text, maps, videos, and other multimedia content to create informative and visually compelling narratives. Wessel featured five case studies from around the United States, explaining the ways in which GIS was helpful to researchers in each of them. She included key findings and sources in text, accompanied by diagrams, photographs, and maps of where the studies took place. Wessel made sure to highlight the researchers’ data acquisition and GIS methods, which she knew would be most helpful to the STARS students who were going to create similar projects for their class.
Mapping Environmental Change
Wessel also created a second project with ArcGIS StoryMaps, this time compiling her own data to present a visual narrative to explain the effects of sea level rise—a subject of longstanding interest. Sperling helped Wessel zero in on certain aspects of the topic—an ambitious task given the great number of publications, databases, and repositories available on climate-change-related issues. “Ultimately,” Sperling said, “we decided to just keep things fairly simple.” The ArcGIS StoryMaps format assisted with that. “People tend to think in stories,” Sperling said, “so anything that you can present to them as a story that they can follow is going to have a much greater impact and be much more easily digested by people who aren’t well versed in the language of climate change.”
With ArcGIS StoryMaps, Wessel said she was able to “guide the narrative arc of the scientific processes.” She explored the role of greenhouse gas emissions, global warming, ice melt, and albedo decrease in the Arctic (albedo refers to the earth’s reflection of solar radiation into the atmosphere). The ArcGIS StoryMaps tools allowed Wessel to edit and digitize maps, create graphic depictions of data, and embed interactive tools to convey more information (in one case showing, with a sliding tool, the drastic reduction in global sea ice from 2001 to 2021). She created a comparable interactive graphic to show the rise of sea level over time in coastal New Haven—the user can expand these interactive maps and zoom in for a closer look. Wessel’s ArcGIS StoryMap was titled “Mapping Environmental Change: A Geospatial Story of Climate Research and Data.”
Map of Life
Wessel also spent time during her fellowship mapping the range of butterfly species in Argentina and Egypt for the Map of Life project, sponsored by the Jetz Lab of the Yale Center for Biodiversity and Global Change. The Map of Life project compiles global, spatial, and biodiversity information. Wessel’s job was to digitize species ranges, harmonize scientific names, edit range maps, and clean data—particularly on the older print maps that were distorted in the process of scanning. Although Wessel already had a sophisticated knowledge of GIS from her class with Tomlin, the GIS team provided Wessel with additional training that would assist her in her work with Map of Life. With their help and through library tutorials, Wessel learned the skill of georeferencing: the process of attaching geographic locations to an image. In weekly team and lab meetings, Wessel also gained insight into the center’s work to support the 30x30 Conservation Plan, a federal initiative to conserve 30% of the country’s land and water by 2030.
“Rebecca did an amazing job,” said Map of Life scientist Yanina Sica, member of the lead data team and Wessel’s supervisor. “She integrated herself very smoothly, engaging in conversations with researchers, data scientists, developers, web engineers, and other members of the Jetz Lab and the Yale BGC center.”
The GIS Community
Olivares recommended that Wessel attend the annual Esri User Conference in San Diego, which she did in July. The conference, attended by more than 16,000 people, gave Wessel the opportunity to engage with a large community of GIS users and gain a larger perspective on what she had learned throughout her fellowship. “Some ideas popped into my head about possible thesis ideas from my conversations with people,” she said. She also learned about the many career opportunities that exist in GIS within state and local governments. “I attended several sessions on racial equity and social justice work. It was really interesting to hear about how GIS can be used in that field, and it’s something I want to keep exploring in the future. I’m definitely looking to continue using GIS for my coursework.”
“I am just so inspired by everybody who I talk to who’s work on amazing projects in this field,” Wessel added. “So, I’m really excited to stay connected with the GIS community at Yale.” Wessel will continue to work with Olivares and the GIS team.
Because GIS is so useful and relevant to all disciplines across campus, Marx Library is considering launching a pilot program to offer GIS training to Yale librarians and staff members next year. GIS Support Services will provide participants with the opportunity to learn about GIS tools like ArcGIS StoryMaps to discover the potential of spatial thinking. Equipped with these skills, librarians and staff can then advise students and faculty about the ways in which GIS tools can enrich their research projects—not just in the sciences but in a wide range of disciplines, including the humanities. “GIS is everywhere,” Olivares said. “The geospatial advantage is a very powerful approach to take to tackle global and local challenges.” More details about the pilot training program will be available later this year.
Read more about Yale Library’s Geographic Information Systems and other online mapping resources. Read more about the STARS program for undergraduates.
—Deborah Cannarella